We provide an easy and intuitive way of analyzing essential data points. This will help our clients identify patterns, trends, and correlations between different datasets quickly, make more informed decisions, and better understand their data.
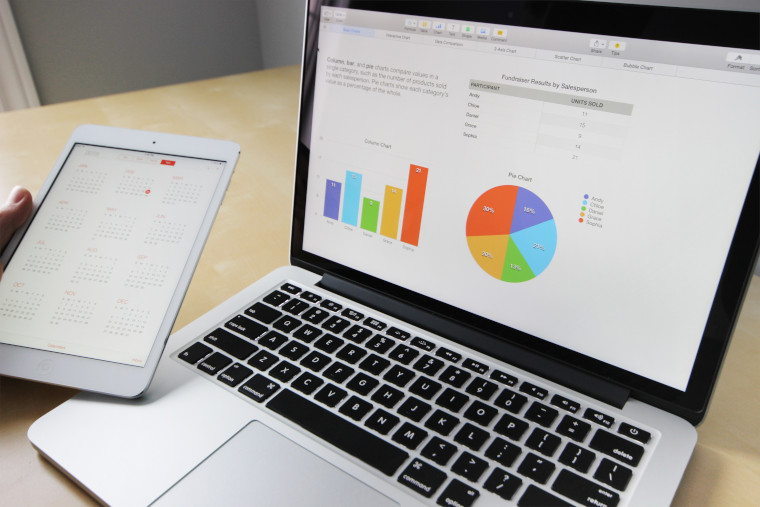
By using interactive visuals such as charts, graphs, and maps, it is possible to see the relationships between different variables more clearly than by looking at raw numbers alone. The visualizations are also designed to be easily understandable, allowing for a more meaningful interpretation of the data. Furthermore, it can be used to present data in a more engaging and visually appealing manner, helping to draw attention to particular details or insights that could otherwise go unnoticed.
The software we use to provide this high-quality service includes Tableau, Microsoft Power BI, Highcharts, and Chartbocks.
We help you make more informed decisions, and better understand your data